Creating a basic procfs file with VisualKernel
Procfs is a virtual file system used by Linux Kernel to report various information to user-mode applications. The kernel and various loaded modules can create arbitrary files inside the /proc folder and control their content. This mechanism is useful when reporting various information to your user-mode client apps.
This tutorial shows how to create a simple file inside /proc using VisualKernel. Before you begin please follow the basic KGDB tutorial or one of the other basic tutorials to ensure that you can create and debug a basic kernel module.
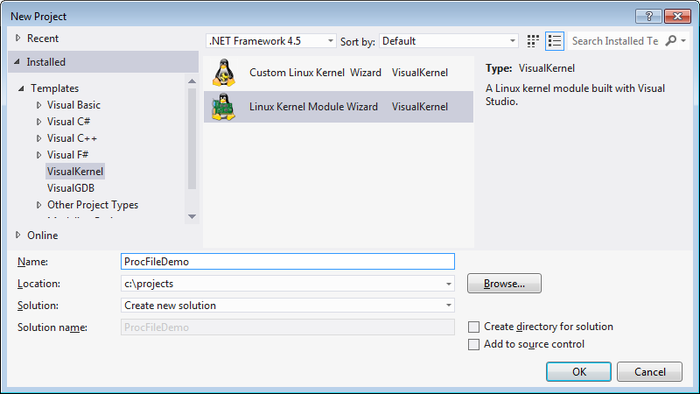
- Start Visual Studio. Select File->New Project->VisualKernel->Linux Kernel Module Wizard:
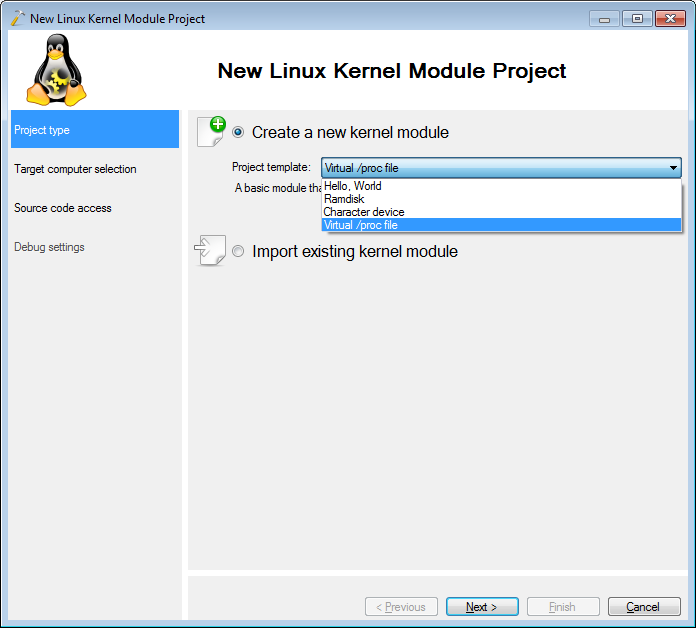
- The VisualKernel Linux Module Wizard will start. Select “Virtual /proc file” on the first page:
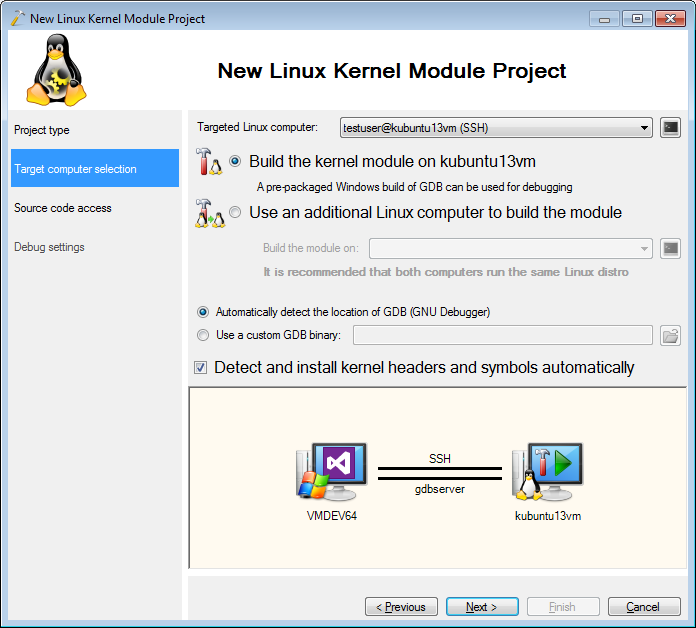
- On the next page select the Linux computer you will use to test your module:
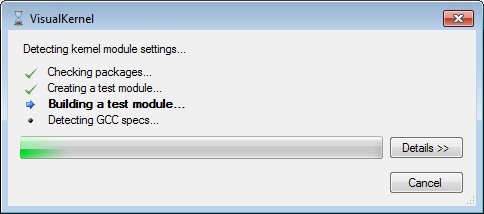
- When you press “Next” VisualKernel will verify that the kernel build tools are usable by building a test kernel module:
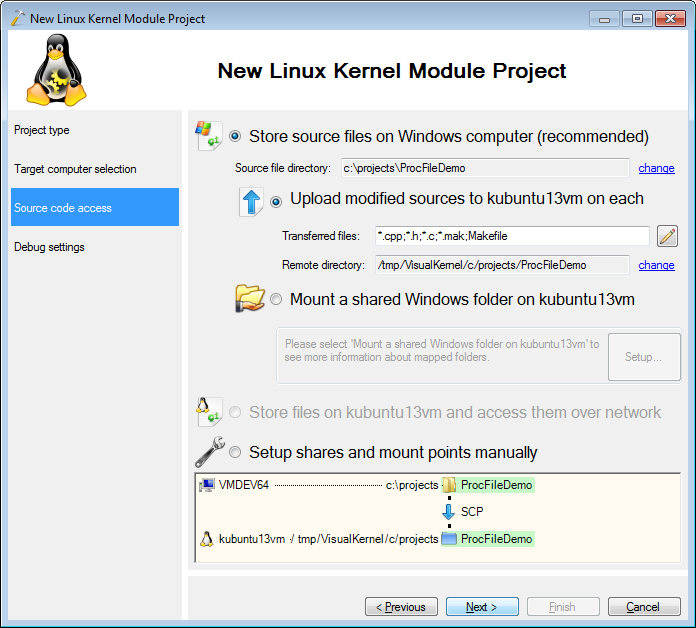
- On the next page select the directory on the Linux machine where you want to store the source code:
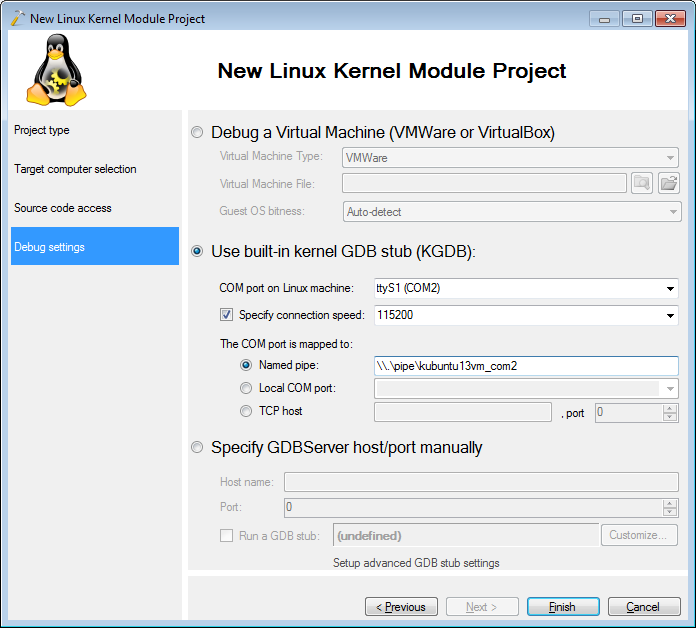
- On the last page specify the debug connection method (e.g. KGDB) so that VisualKernel can debug your machine:
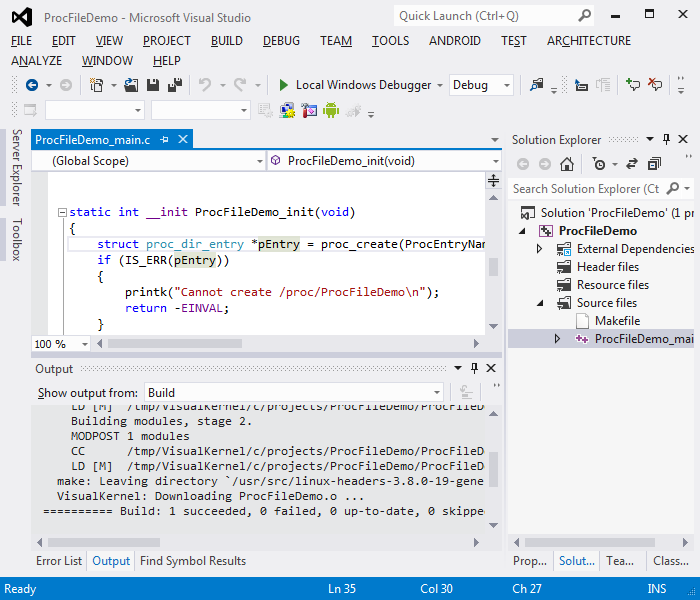
- When you press “Finish”, VisualKernel will generate a Visual Studio project for you. When you build it, the source files will be automatically sent to the Linux machine and built there:
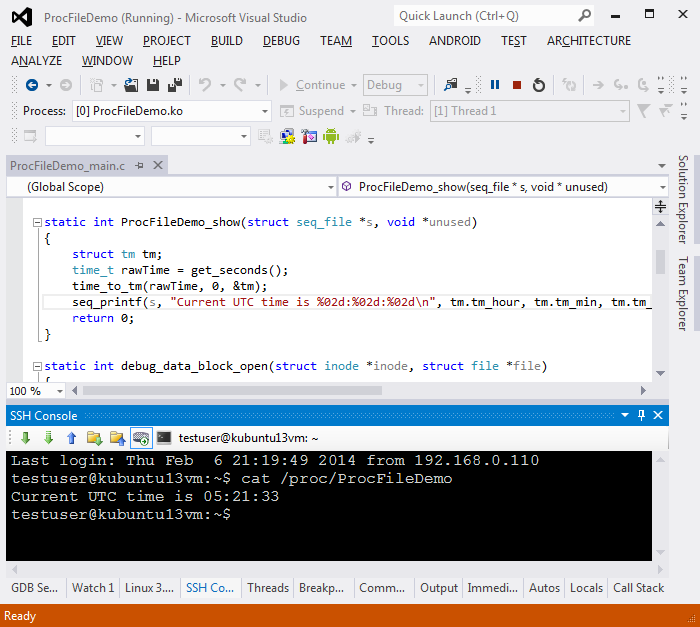
- Press F5 to start debugging your module. You will see hints on testing it displayed via printk():
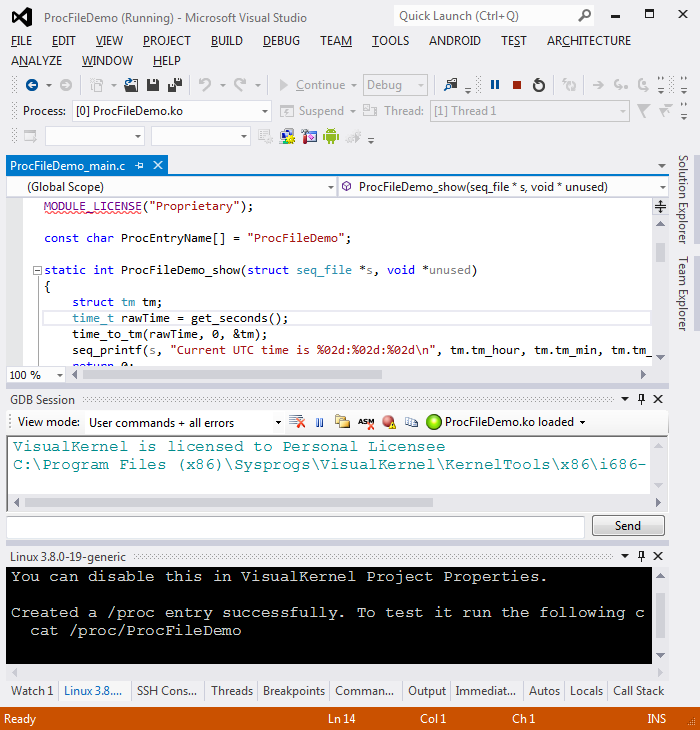
- Open the SSH Console window and run the ‘cat /proc/<Your project name>’ command. You will see the output produced by the ProcFileDemo_show() function:
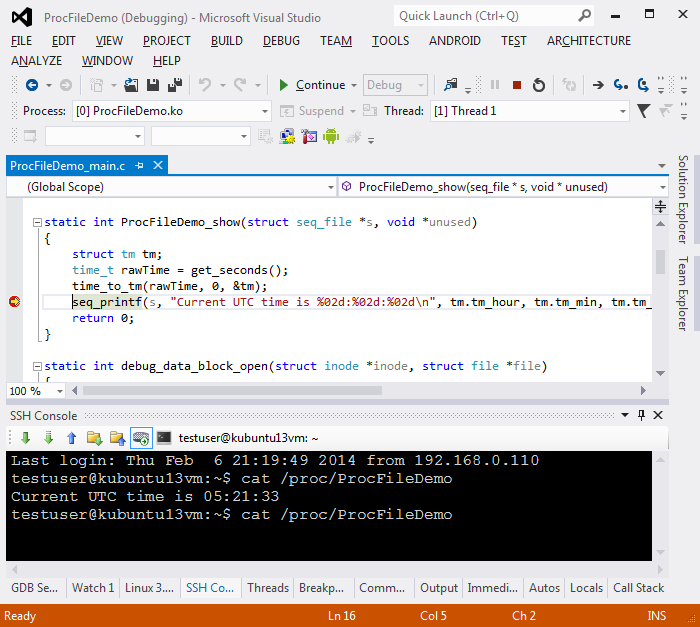
- Set a breakpoint in the function and re-run the command. The breakpoint will hit:
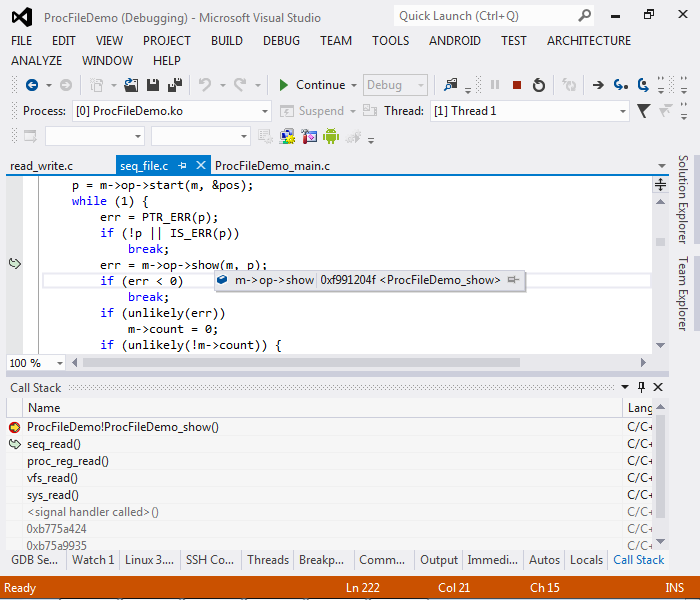
- Use the Call Stack window to see how ProcFileDemo_show() was called by seq_read() that handles the ‘read’ callback, buffers the data produced by seq_printf() and returns it to the user in correctly sized chunks:
- Press F5 to continue debugging. Set a breakpoint inside the init function and reload your driver via the GDB Session window:
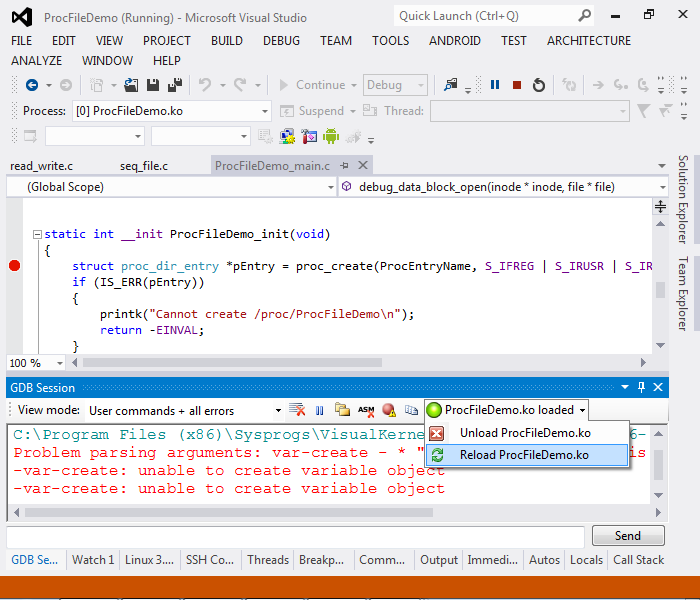
- Once the breakpoint is hit you can press F11 to step into proc_create() and see how the file object is initialized:
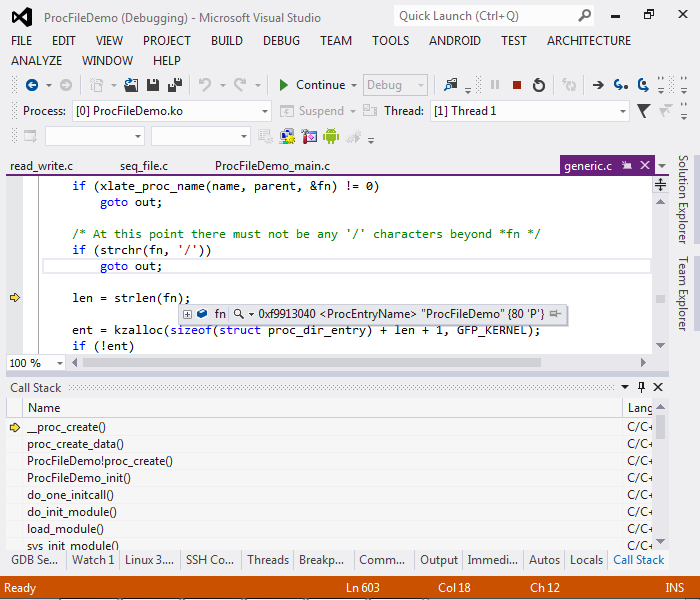 Note that as the normal Linux kernel is built with optimization enabled, stepping through the kernel code will look a bit chaotic. This happens because GCC optimizer reuses some parts of the code that makes it difficult for GDB to map it back to the source code locations. Rebuild your kernel without optimization to resolve this.