Linux Kernel Symbol Overview
Debugging Linux kernel modules using gdb is different from debugging normal user-mode applications. Unlike user-mode where gdb can automatically load the symbols for the main executable and all loaded shared libraries, kernel-mode only supports loading the symbols for the kernel itself. Although VisualKernel fully automates the symbol loading process, this page explains what happens “under the hood” and what mechanisms are involved.
Manual symbol loading using GDB
To demonstrate how symbol loading is performed we can create and load a basic kernel module that includes an exit function:
static void __exit TestKernelModule_exit(void)
{
    printk("TestKernelModule: Goodbye, world!\n");
}
If we load the module and start a kernel debugging session using KGDB or VMWare, gdb will load the kernel symbols, but not the symbols for the module. E.g. we will be able to set breakpoints inside the kernel itself (e.g. the sys_open() function), but not inside TestKernelModule_exit():
(gdb) file vmlinux-3.8.0-19-generic
Reading symbols from vmlinux-3.8.0-19-generic...done.
(gdb) b sys_open
Breakpoint 1 at 0xc115f000: file /build/buildd/linux-3.8.0/fs/open.c, line 995.
(gdb) b TestKernelModule_exit
Function "TestKernelModule_exit" not defined.
Make breakpoint pending on future shared library load? (y or [n]) n
Unlike the kernel itself that is always loaded at the same address in memory, kernel modules can be loaded at arbitrary addresses. Before we can load the symbols for a module, we need to find out at which address it was loaded. The easiest way to do it is to set a breakpoint in the do_init_module() function and once it hits, checking the name and module_core fields of the mod variable:
(gdb) break do_init_module
Breakpoint 2 at 0xc10ac8e8: file /build/buildd/linux-3.8.0/arch/x86/include/asm/
current.h, line 14.
(gdb) continue
Continuing.
Breakpoint 2, load_module
at /build/buildd/linux-3.8.0/kernel/module.c:3271
3271 /build/buildd/linux-3.8.0/kernel/module.c: No such file or directory.
(gdb) print mod
$1 = (struct module *) 0xf9921000
(gdb) print mod->name
$2 = "TestKernelModule", '\000' <repeats 43 times>
(gdb) print mod->module_core
$3 = (void *) 0xf9928000
Now once we know the load address of the module, we can load the symbols for it using the add-symbol-file command. The symbols are contained in the file called <module name>.o in the module build directory:
(gdb) add-symbol-file TestKernelModule.o 0xf9928000
add symbol table from file "TestKernelModule.o" at
.text_addr = 0xf9928000
(y or n) y
Reading symbols from TestKernelModule.o...done.
Note that if you now attempt to set a breakpoint in the TestKernelModule_exit() function, gdb will set it in an invalid address:
(gdb) break TestKernelModule_exit
Breakpoint 3 at 0x19: file TestKernelModule_main.c, line 13.
This happens because the TestKernelModule_exit() function is located in the “.exit.text” section and we have only loaded the symbols for the “.text” section. Use the following command to display all sections of TestKernelModule that has been loaded into the memory:
(gdb) print *mod->sect_attrs->attrs@mod->sect_attrs->nsections
$1 = {{
mattr = {...},
name = ".note.gnu.build-id",
address = 0xf9929000
}, {
mattr = {...},
name = ".init.text",
address = 0xf842a000
}, {
mattr = {...},
name = ".exit.text",
address = 0xf9928000
}, {
mattr = {...},
name = ".rodata",
address = 0xf9929024
}, {
mattr = {...},
name = ".data",
address = 0xf992a000
}, {
mattr = {...},
name = ".gnu.linkonce.this_module",
address = 0xf992a020
}, {
mattr = {...},
name = ".bss",
address = 0xf992a1a0
}, {
mattr = {...},
name = ".symtab",
address = 0xf842b000
}, {
mattr = {...},
name = ".strtab",
address = 0xf842b270
}}
To load the symbols for those sections as well we need to specify their addresses manually in the add-symbol-file command:
add-symbol-file KernelModule.o 0xf9928000 -s .init.text 0xf842a000 -s .exit.text 0xf9928000
add symbol table from file "TestKernelModule.o" at
.text_addr = 0xf9928000
.init.text_addr = 0xf842a000
.exit.text_addr = 0xf9928000
(y or n) y
Reading symbols from TestKernelModule.o...done.
(gdb) b TestKernelModule_exit
Breakpoint 5 at 0xf9928006: file TestKernelModule_main.c, line 17.
Now the breakpoint was set at the correct address. Note that in order to see the global variables in the debugger, you need to also manually specify the addresses of the .data, .rodata and .bss sections.
You can explore all modules loaded into the kernel by looking through the global ‘modules’ list. Simply use the ‘next’ field to get the pointer to the list item corresponding to the next module and subtract 4 (the offset of the list item inside the module structure) from it to get the address of the module object:
(gdb) print &((struct module *)0)->list
$10 = (struct list_head *) 0x4
(gdb) print modules
$11 = {
next = 0xf9962024,
prev = 0xf8453024
}
(gdb) print *((struct module *)(0xf9962024 - 0x4))
$12 = {
state = MODULE_STATE_LIVE,
list = {
next = 0xf98fc004,
prev = 0xc18a1658 <modules>
},
name = "TestKernelModule", '\000' <repeats 43 times>,
...
Automatic symbol loading using VisualKernel
When you start your debugging session, VisualKernel will automatically set breakpoints inside the kernel functions responsible for loading and unloading the modules. When your module is loaded or unloaded, VisualKernel will automatically load/unload the symbols for it: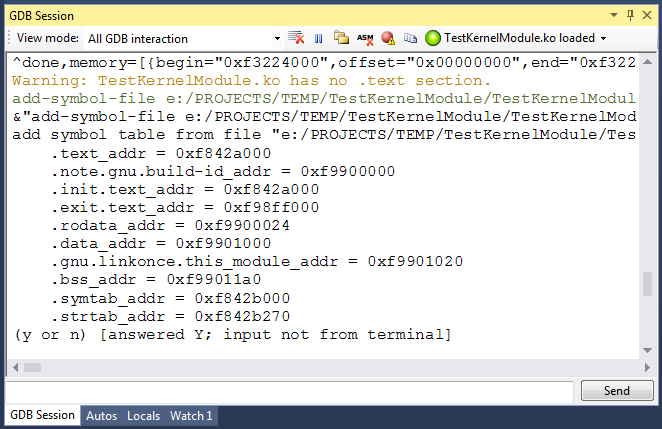
You can use the Modules window in Visual Studio to see the list of currently loaded kernel modules and load symbols for them:
You can configure VisualKernel to automatically load symbols for all or some of the in-tree kernel modules (that ones that are included in the original Linux kernel tree):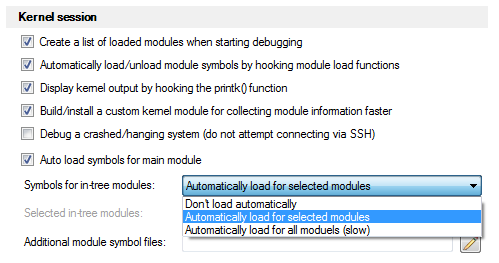
See our KGDB tutorial for a step-by-step guide on debugging your kernel with VisualKernel.